Vehicle Usage
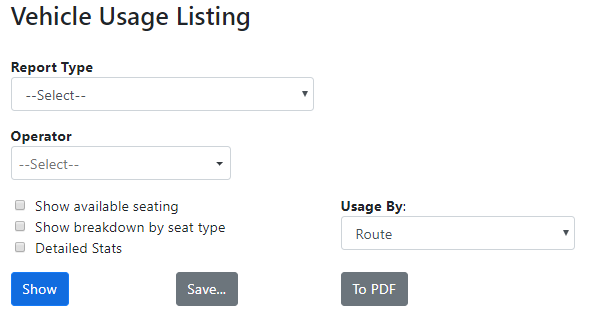
The Vehicle Usage report allows you to see detailed information on the capacity usage of the bus. These include the vehicle information, the total capacities, average loads, and usage and max loads and usage. This tool displays the same information as the Vehicle Capacity Summary in BusPlanner’s Analysis menu.
Note: The Vehicle Usage by Route and Vehicle Usage by Run are the same dialog. The Route option allows you to search by route, component, or run, while the Run option only allows you to search by component or run.

•Component – The AM vs. PM section of the route. This can be used to narrow down the resulting list..
•Component – The AM vs. PM section of the route.
•Show – Will produce resulting list of routes/runs on the screen.
•Save – Will produce a resulting list of routes/runs in an Excel file which can then be saved on the local machine.
•All Routes/Runs – Leaving the Route or Run dropdown box as All Routes or All Runs will display or show all of the routes or runs to which you have access. This cannot be shown on the web page, and can only be saved to PDF on the client’s machine.
•Show breakdown by seat type – Shows the information in this report separated by each individual seat type available on the routes/runs.
•Detailed Stats - When not checked, columns in the search results that provided extra percentage calculations are omitted.
•Usage by – Allows you to show the vehicle usage by route or run.
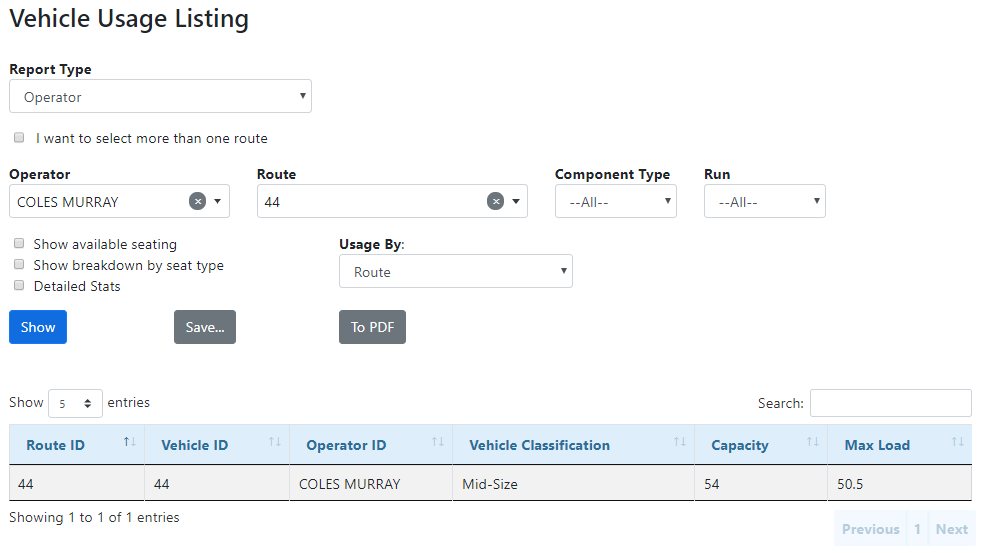
 Vehicle Usage – Search Results
•Vehicle Classification – The government vehicle class. Used to separate large buses, small buses, and special use buses. •Regular Capacity – The total number of regular seats on a bus. •Wheelchair Capacity – The total number of wheelchair spaces on a bus. •Regular Avg Max Load – The average number of regular students on the bus. •Wheelchair Avg Max Load – The average number of students in wheelchairs on the bus. •Regular Avg % Usage – The weighted number of regular students on the bus (included if Detailed Stats was checked.) •Wheelchair Avg % Usage – The weighted number of students in wheelchairs on the bus (included if Detailed Stats was checked.) •Regular Max Load – The maximum number of regular students on the bus. •Wheelchair Max Load – The maximum number of students in wheelchairs on the bus. •Regular Avail – The number of remaining available Regular seats. •Wheelchair Avail – The number of remaining available Wheelchair seats. •Regular Max % Usage – The highest usage of weighted regular students on a bus (included if Detailed Stats was checked.) •Wheelchair Max % Usage – The highest usage of weighted wheelchair students on a bus (included if Detailed Stats was checked.) |
